Feyn - Symbolic AI using the QLattice
The QLattice is an explainable symbolic AI that accelerates research and scientific discovery.
With Feyn, exploring and understanding relationships in your data is made easy, putting the science in data science.
Quick start
Quick start
From zero to scientific hero.
Just pip install feyn.
Using Feyn
Using Feyn
Get started with complete examples for classification and regression.
Feyn in 5 minutesAPI reference
API reference
The Feyn Python module in all of its nitty-gritty details.
API ReferenceExtra, extra!
Feyn 3.3.0 is out!
Feyn 3.3.0 is out!
We've added an automatic response plot to make it easier to compare and understand your models.
We've also added support for the upcoming release of numpy, so you're ready to go when it hits.
See the full changelog here
In other news...
Read about our other recent new features and additions to the Feyn Documentation.
You can also check out our changelog here.
Insert data -
press play!
Insert data -
press play!
Get started even faster with automatic type detection for your data when using Auto Run.

Stratify your data
Stratify your data
Stratify your data splits across multiple columns with the built-in function.

Speed things up with Auto Run
Speed things up with Auto Run
Auto run comes batteries included so you can solve your problems with just one line of code

Get going with our Beginner Tutorials for common cases
Learn the QLattice workflow through solving well-known problems.
Titanic Dataset
Titanic Dataset
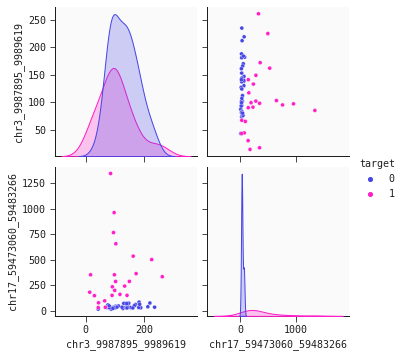
Explore the Titanic dataset using Feyn and the QLattice for classification.
AirBnB Rental Prices
AirBnB Rental Prices
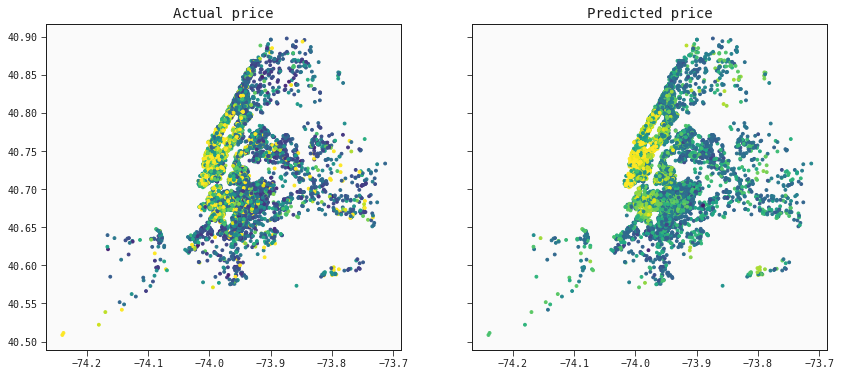
Explore the AirBnB dataset, using Feyn and the QLattice for regression.
Pulsar Stars
Pulsar Stars
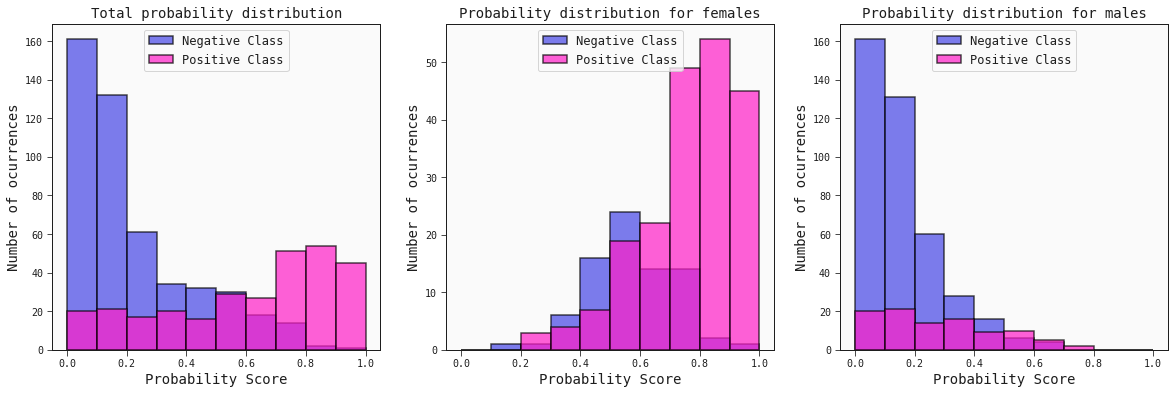
A fun classification problem for classifying whether a star is a pulsar.
Dust off your QLattice skills in life sciences
Explore how you can use the QLattice to solve problems in life science.
Stanford COVID-19 vaccine
Stanford COVID-19 vaccine
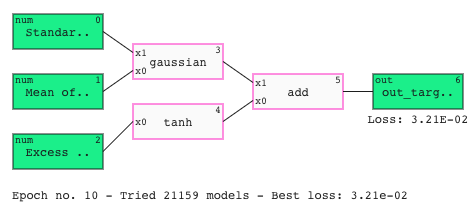
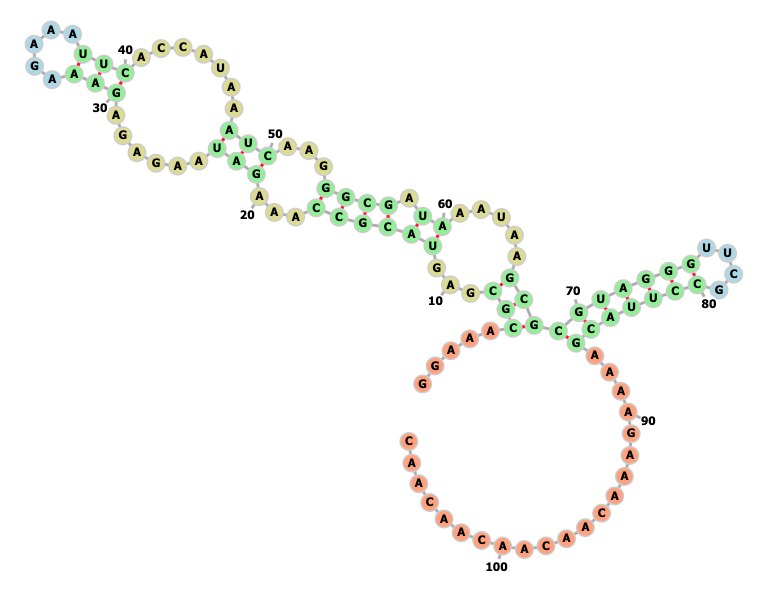
Explore the Stanford COVID-19 dataset, using the QLattice for regression.
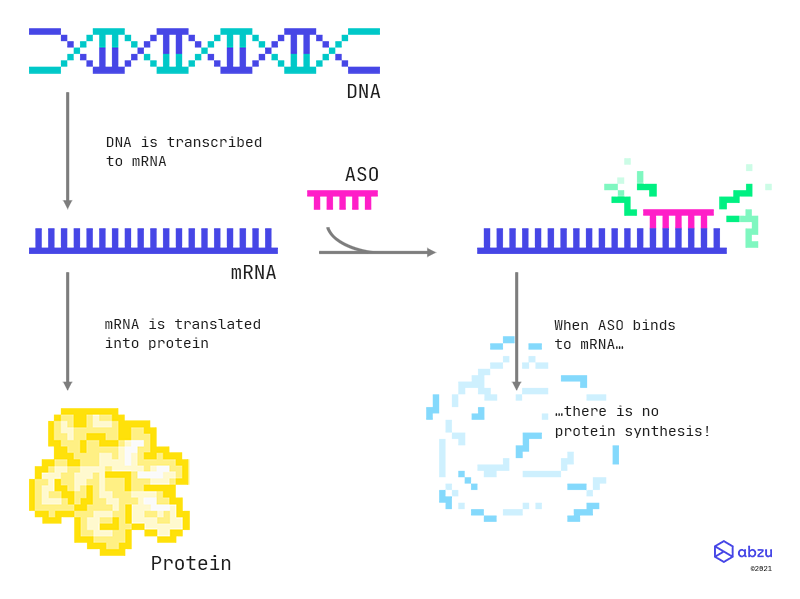
Feyn and R for ASOs
Feyn and R for ASOs
Explore antisense oligonucleotides in your familiar workflow combining Feyn with R.
Detecting Liver Cancer (HCC)
Detecting Liver Cancer (HCC)
Determine liver cancer in patients using biomarkers