Pulsar stars
by: Chris Cave
Feyn version: 2.1+
Last updated: 23/09/2021
Here we use the QLattice to classify whether a star is a pulsar star or not. A pulsar star is a rare type of neutron star.
The purpose of this tutorial is to use the auto_run function of the QLattice to obtain models fitted to the data.
import feyn
import numpy as np
import pandas as pd
import matplotlib.pyplot as plt

from sklearn.model_selection import train_test_split
Load data and split
A description of the dataset can be found here.
random_seed = 42

data = pd.read_csv('../data/pulsar_stars.csv')
output_name = 'out_target_class'
train, test = train_test_split(data, test_size=0.4, random_state=random_seed, stratify=data[output_name])
Calculate sample weights
This is a very unbalanced dataset where that are about 10 times as many negative classes as there are positive classes. This means we will use the sample_weights parameter in the auto_run to improve performance of the classifier
First we calculate the sample weights using sklearn's compute_sample_weight.
from sklearn.utils.class_weight import compute_sample_weight

sample_weights = compute_sample_weight(class_weight='balanced', y=train[output_name])
Use auto_run to obtain fitted models
# Connect to a QLattice

ql = feyn.connect_qlattice()
ql.reset(random_seed=random_seed)

# Use the auto_run function to obtain models

models = ql.auto_run(
    data=train,
    output_name=output_name,
    kind='classification',
    sample_weights=sample_weights #Here we use sample_weights for unbalanced data
    )
best = models[0]
Summary
This return the metrics of the model on the train and test set.
best.plot(train,test)
Training Metrics
Test
Evaluate
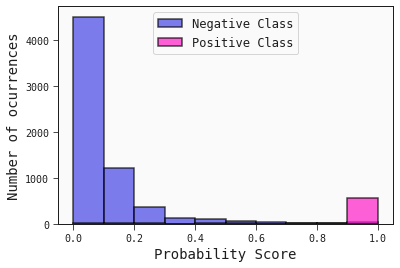
Here we plot the historgram of the predicted probabilities of the test set. This gives similar information that the ROC curve does. It shows how well the classifier has separated the classes.
best.plot_probability_scores(test)

