Feyn Documentation

Feyn Documentation

  • Learn
  • Guides
  • Tutorials
  • API Reference
  • FAQ

›Classification

Overview

  • Tutorials

Beginner

    Classification

    • Titanic survival
    • Pulsar stars
    • Poisonous Mushrooms

    Regression

    • Airbnb prices
    • Automobile MPG
    • Concrete strength

Advanced

    Regression

    • Wine Quality

Use cases

  • Rewriting models with correlated inputs
  • Complexity-Loss Trade-Off
  • Plotting the loss graph
  • Simple linear and logistic regression
  • Deploy a model for inference

Life Sciences

    Classification

    • Detecting Liver Cancer (HCC) in Plasma
    • Classifying toxicity of antisense oligonucleotides

    Regression

    • Covid-19 RNA vaccine degradation data set
    • Preventing the Honeybee Apocalypse (QSAR)

Interfacing with R

  • Classifying toxicity of antisense oligonucleotides

Archive

  • Covid-19 vaccination RNA dataset.

Pulsar stars

by: Chris Cave

Feyn version: 2.1+

Last updated: 23/09/2021

Here we use the QLattice to classify whether a star is a pulsar star or not. A pulsar star is a rare type of neutron star.

The purpose of this tutorial is to use the auto_run function of the QLattice to obtain models fitted to the data.

import feyn
import numpy as np
import pandas as pd
import matplotlib.pyplot as plt

from sklearn.model_selection import train_test_split

Load data and split

A description of the dataset can be found here.

random_seed = 42

data = pd.read_csv('../data/pulsar_stars.csv')
output_name = 'out_target_class'
train, test = train_test_split(data, test_size=0.4, random_state=random_seed, stratify=data[output_name])

Calculate sample weights

This is a very unbalanced dataset where that are about 10 times as many negative classes as there are positive classes. This means we will use the sample_weights parameter in the auto_run to improve performance of the classifier

First we calculate the sample weights using sklearn's compute_sample_weight.

from sklearn.utils.class_weight import compute_sample_weight

sample_weights = compute_sample_weight(class_weight='balanced', y=train[output_name])

Use auto_run to obtain fitted models

# Connect to a QLattice

ql = feyn.connect_qlattice()
ql.reset(random_seed=random_seed)

# Use the auto_run function to obtain models

models = ql.auto_run(
    data=train,
    output_name=output_name,
    kind='classification',
    sample_weights=sample_weights #Here we use sample_weights for unbalanced data
    )
Loss: 3.26E-02Epoch no. 10/10 - Tried 17395 models - Completed in 46s.out_target_class logistic: w=-4.8529 bias=-0.7364out_targ..0outaddadd1 Excess kurtosis of the integrated profile linear: scale=0.201095 w=-4.426805 bias=0.2769 Excess ..2numgaussian2gaussian3 Standard deviation of the DM-SNR curve linear: scale=0.019366 w=-2.266274 bias=0.3547 Standar..4num Mean of the integrated profile linear: scale=0.010706 w=1.184789 bias=-0.8379 Mean of..5num
best = models[0]

Summary

This return the metrics of the model on the train and test set.

best.plot(train,test)
out_target_class logistic: w=-4.8529 bias=-0.7364out_targ..0outaddadd1 Excess kurtosis of the integrated profile linear: scale=0.201095 w=-4.426805 bias=0.2769 Excess ..2numgaussian2gaussian3 Standard deviation of the DM-SNR curve linear: scale=0.019366 w=-2.266274 bias=0.3547 Standar..4num Mean of the integrated profile linear: scale=0.010706 w=1.184789 bias=-0.8379 Mean of..5numTraining MetricsAccuracy0.966AUC0.976Precision0.765Recall0.908Test0.9680.9730.7750.919Inputs Excess kurtosis of the integrated profile Standard deviation of the DM-SNR curve Mean of the integrated profile

Training Metrics

Test

Evaluate

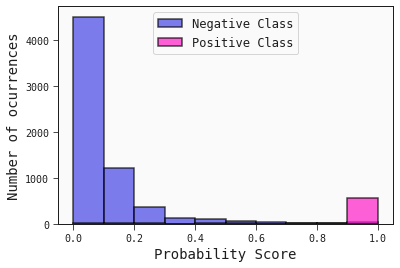
Here we plot the historgram of the predicted probabilities of the test set. This gives similar information that the ROC curve does. It shows how well the classifier has separated the classes.

best.plot_probability_scores(test)

png

← Titanic survivalPoisonous Mushrooms →
  • Load data and split
  • Calculate sample weights
  • Use auto_run to obtain fitted models
  • Summary
  • Evaluate

Subscribe to get news about Feyn and the QLattice.

You can opt out at any time, and you can read our privacy policy here.

Copyright © 2024 Abzu.ai - Feyn license: CC BY-NC-ND 4.0
Feyn®, QGraph®, and the QLattice® are registered trademarks of Abzu®