Visualise a model
by: Kevin Broløs and Chris Cave
(Feyn version 3.0 or newer)
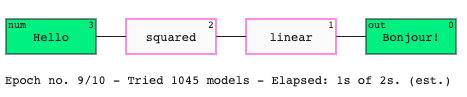
All Models can be visualised as a directed graph. Inputs are on the left hand side and the output is on the right hand side. Each node represents a mathematical transformation and the activation values move from left to right.
Example
If you are in a Jupyter environment then a Model automatically displays as a graph.
import feyn

ql = feyn.QLattice()
models = ql.sample_models(['Hello', 'World'], 'Bonjour!','classification')

models[0]
Live reload
If you want to update the display within a Jupyter cell then you can use the show_model function.
for model in models[0:5]:
    feyn.show_model(
        model=model,
        update_display=True
    )
If update_display=False then the previous Model will not be cleared and the next Model will instead be displayed beneath it.
A typical case to use this function is when you're making your own custom workflow with the primitive operations and you want to see the best Model in the current epoch of the fitting loop.
Interactivity
In a Jupyter environment, you'll be able to hover over each of the interactions to get a tooltip with the internal state of it - such as the weights, biases and encodings.
Showing progress during training
If you're using the primitives, you might want to use the label under the model to display some progress information. feyn.tools.get_progress_label gives the default display that is also used in auto_run. It takes the current epoch and max epochs, and an optional elapsed time in seconds and model count, if you want to display information about progress and estimate time to completion.
Here's an example:
ql = feyn.QLattice()

n_epochs = 10
model_count = 0
elapsed = 0

from time import time
start = time()

for epoch in range(1, n_epochs+1):
    models = ql.sample_models(['Hello', 'World'], 'Bonjour!','classification')

    # Actual fitting and updating not displayed here

    model_count += len(models)
    elapsed = time() - start
    models[0].show(
        label = feyn.tools.get_progress_label(epoch, n_epochs, elapsed_seconds = elapsed, model_count = model_count),
        update_display=True
    )