Plot response
by: Kevin Broløs
(Feyn version 3.4.0 or newer)
Each Model has a plot_response_auto function to plot the partial relationship of its inputs to the predicted output. This allows you to see how the inputs interact and affect the predictions, and understand the behaviour of the Model.
This function automatically decides which inputs to include on the plot, fixing any remaining inputs to the median if it's numeric, or the mode if it's categorical. If you want more control over this, you can use the underlying Plot Response 2D or Plot Response 1D functions on your own to inspect the remaining features, different relationships or ways of fixing values.
Example
import feyn
from sklearn.datasets import load_breast_cancer

# Load into a pandas dataframe
data = load_breast_cancer(as_frame=True).frame

# Train/test split
train, test = feyn.tools.split(data, ratio=[0.6, 0.4], stratify='target', random_state=42)

# Instantiate a QLattice
ql = feyn.QLattice(random_seed=42)

# Sample and fit models
models = ql.auto_run(
    data=train,
    output_name='target'
)

best = models[0]

Automatically plotting the response plot
The function plot_response_auto automatically fixes the values other than the two chosen inputs and displays the result.
best.plot_response_auto(data=train)
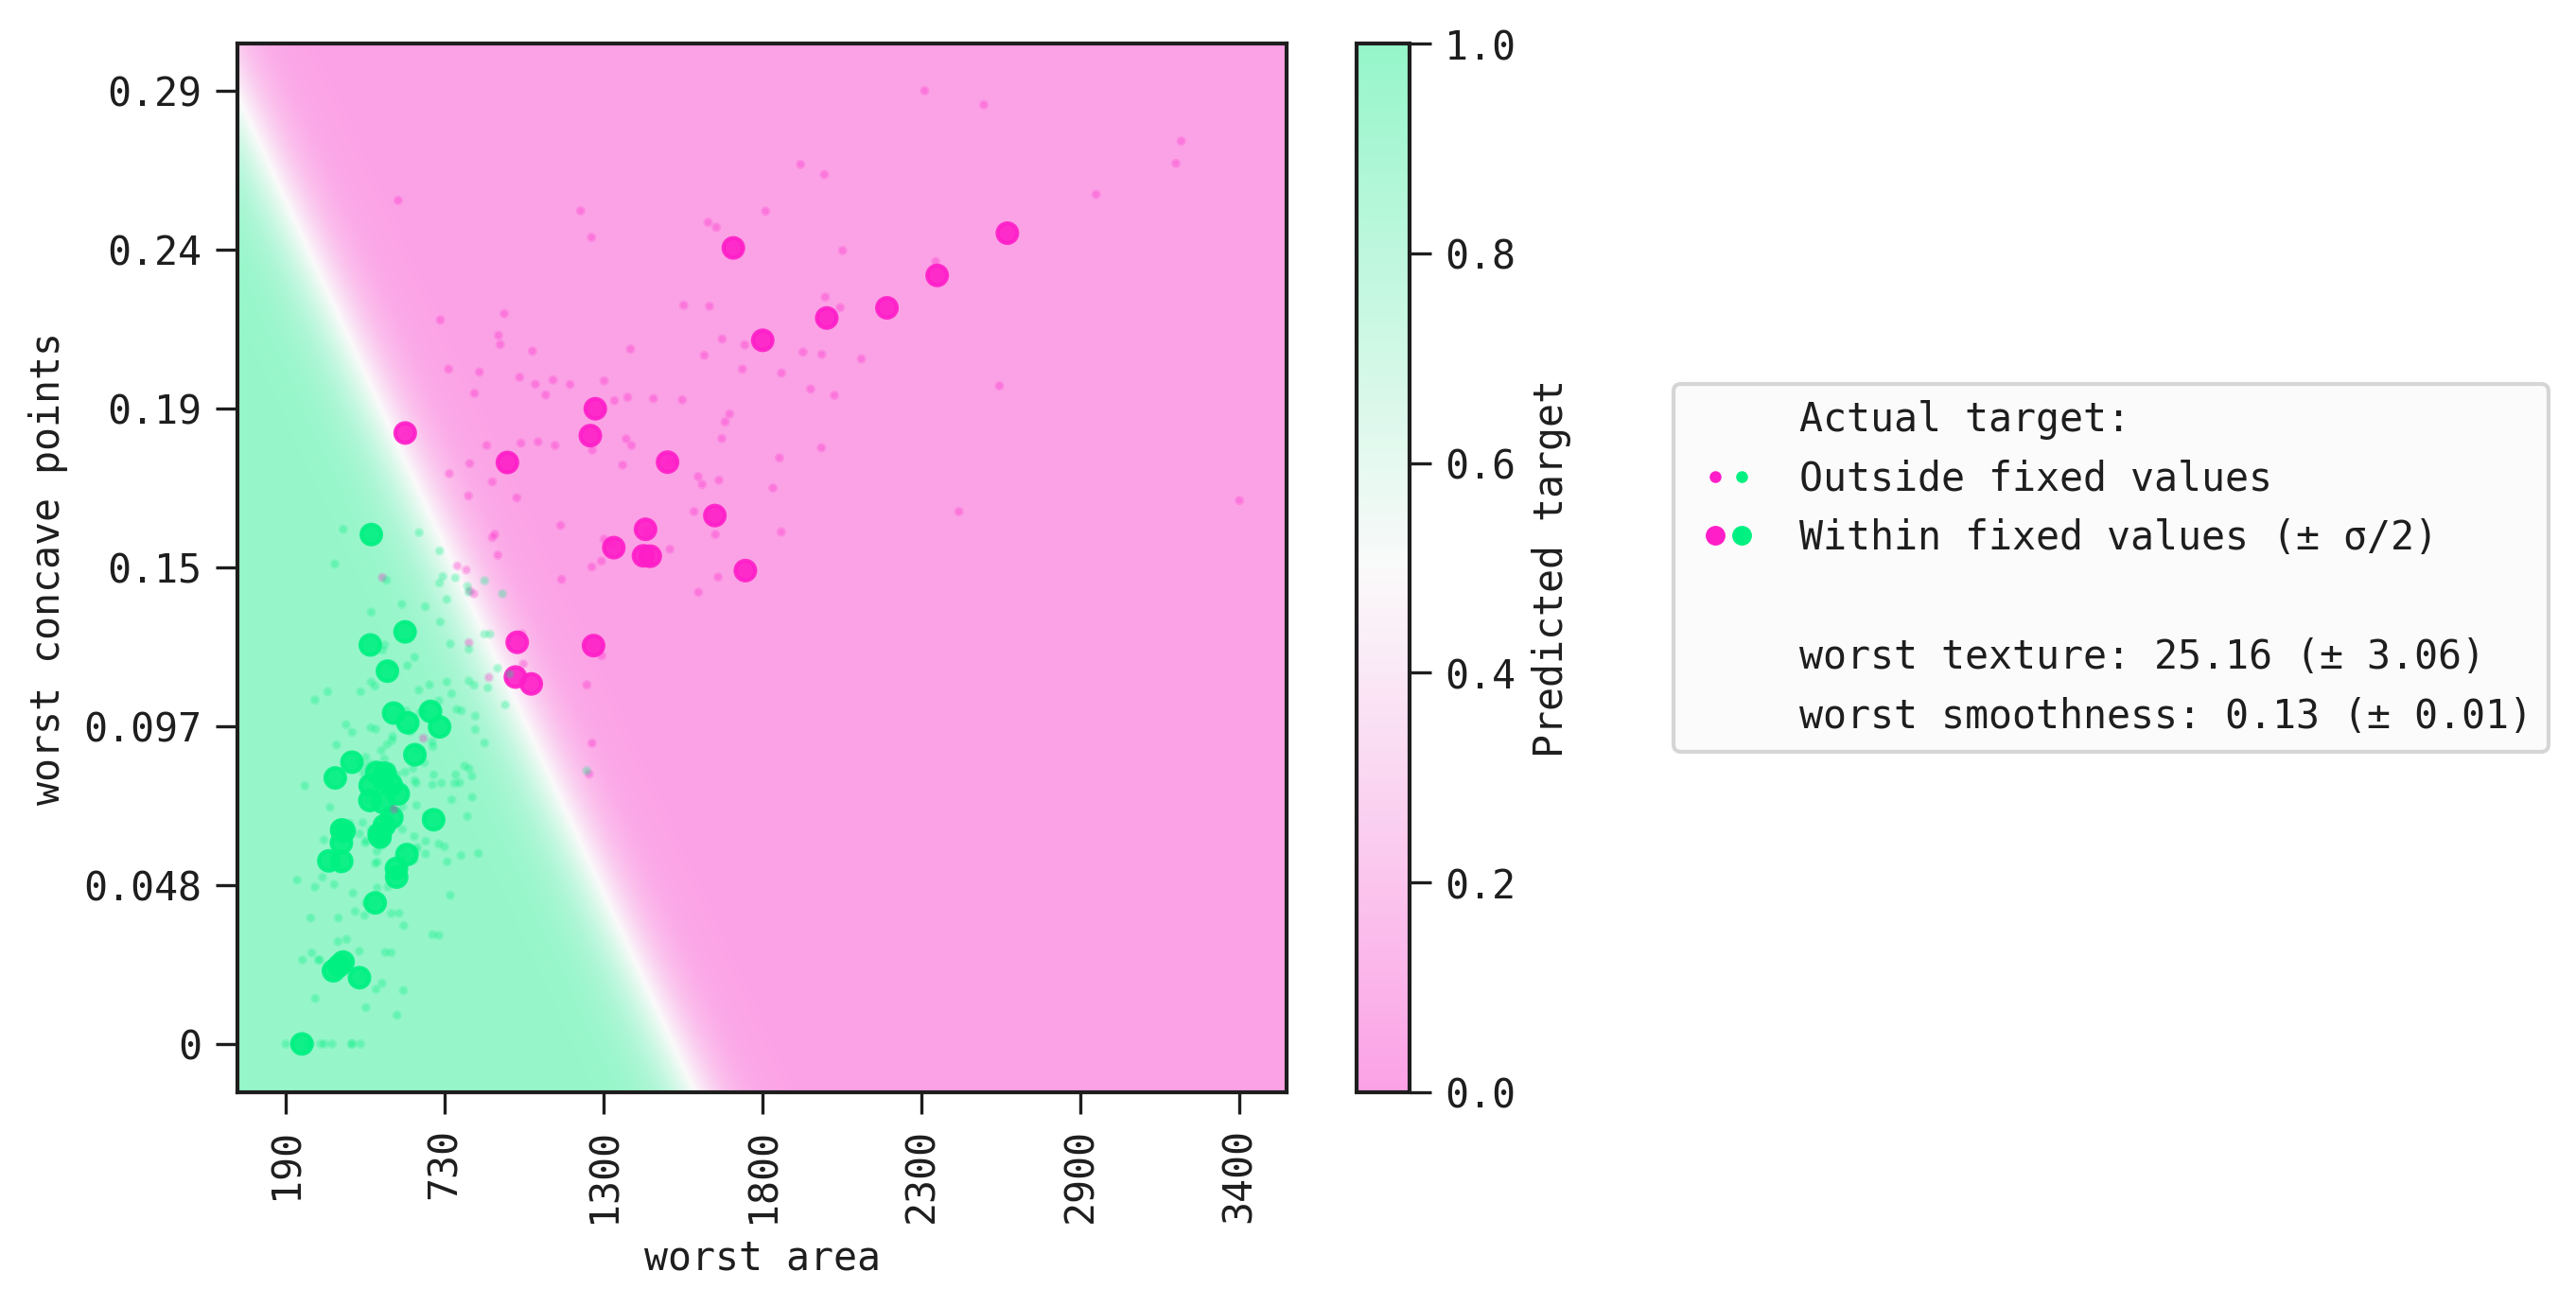
We can clearly see the boundary that separates the positive class from the negative class. Lastly, large markers are the samples whose values correspond to those in fixed.
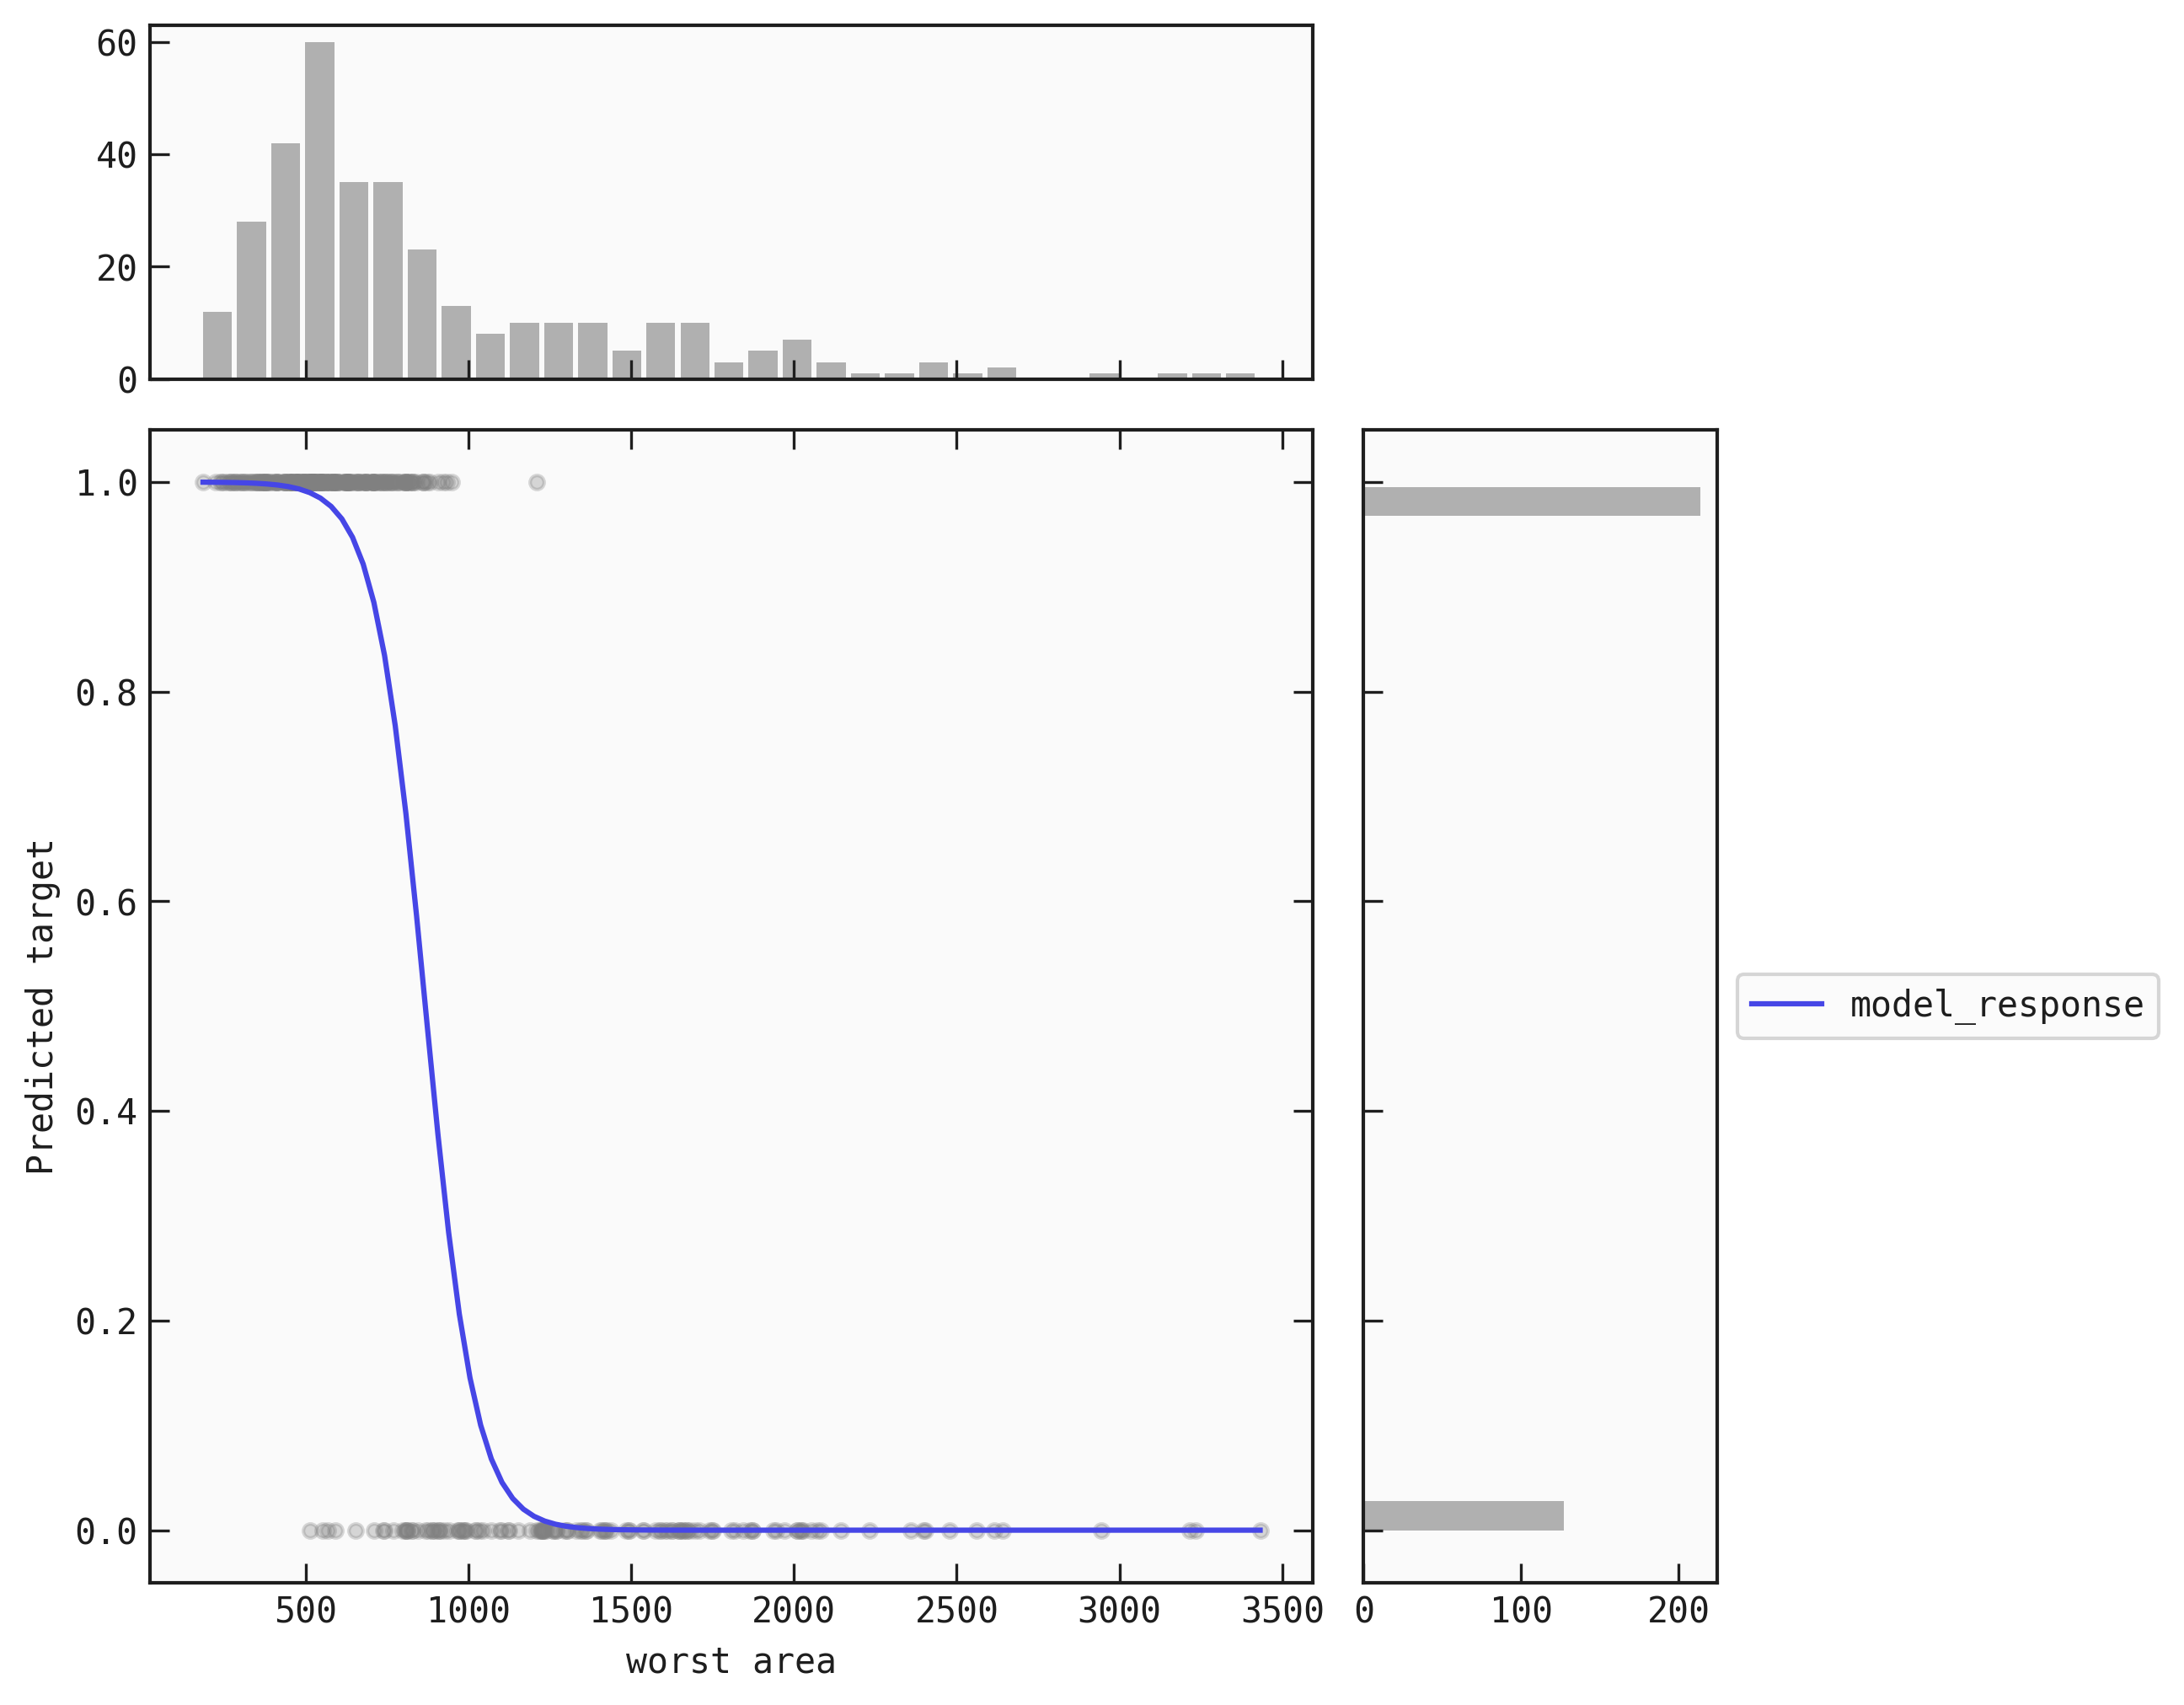
An example with a single feature model
models = ql.auto_run(
    data=train,
    output_name='target',
    query_string='"worst area"'
)
best = models[0]

best.plot_response_auto(data=train)
Saving the plot
You can also save the plot using the filename parameter. The plot is saved in the current working directory unless another path specifed.
best.plot_response_auto(data=train, filename="feyn-plot")
If the extension is not specified then it is saved as a png file.
Parameters of plot_response_auto
You can see the full parameter list on the API Reference.
Location in Feyn
This function can also be found in the feyn.plots module .
from feyn.plots import plot_model_response_auto

plot_model_response_auto(model=best, data=train)