Using Feyn
by: Kevin Broløs & Meera Machado
(Feyn version 3.4.0 or newer)
Let's get you up to speed on how to use Feyn and the auto_run function for regression and classification with some examples.
Use the selector to inspect the use cases below:
Regression
Let's go through the Diabetes dataset made available by scikit-learn to showcase the usage of auto_run for regression.
# Import dependencies
import feyn

import pandas as pd
from sklearn.datasets import load_diabetes

# Load into a pandas dataframe
dataset = load_diabetes()
df_diabetes = pd.DataFrame(dataset.data, columns=dataset.feature_names)
df_diabetes['response'] = dataset.target

# Train/test split
train, test = feyn.tools.split(df_diabetes, ratio=[0.6, 0.4], random_state=42)
We run the QLattice to obtain models that are fitted to this dataset. The easiest way is to use the auto_run function.
# Instantiate a QLattice
ql = feyn.QLattice(random_seed=42)

# Sample and fit models
models = ql.auto_run(
    data=train,
    output_name='response'
)
Evaluating your models
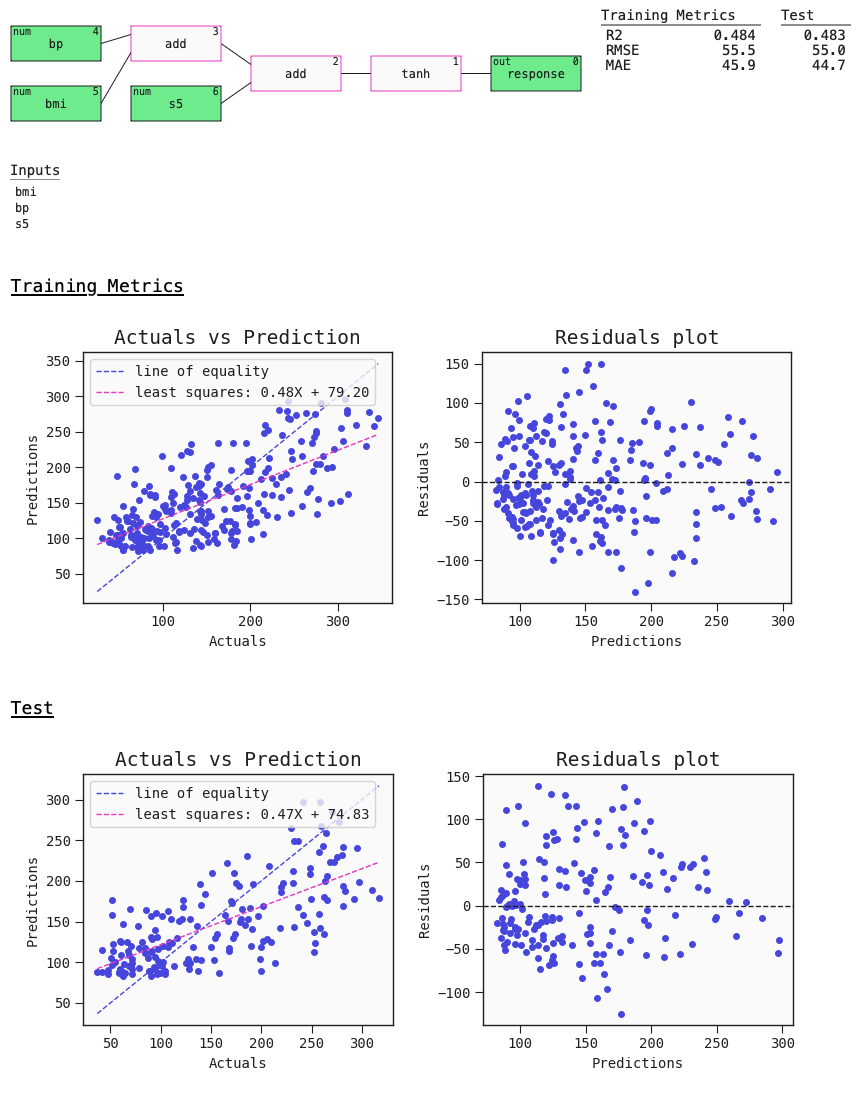
The auto_run function returns a list with the 10 best diverse models sorted by ascending loss. Here's a summary plot with metrics. This plot also contains useful default plots for your estimator - in this case the regression plot and residuals plot:
# Best model
best = models[0]

best.plot(train, test)

Classification
Let's go through the classic UCI ML Breast Cancer Winsconsin (Diagnostic) dataset to showcase the usage of auto_run for classification.
import feyn
from sklearn.datasets import load_breast_cancer


# Load into a pandas dataframe
breast_cancer = load_breast_cancer(as_frame=True)
data = breast_cancer.frame

# Train/test split
train, test = feyn.tools.split(data, ratio=[0.6, 0.4], stratify='target', random_state=42)
We run the QLattice to obtain models that are fitted to this dataset. The easiest way is to use the auto_run function.
# Instantiate a QLattice
ql = feyn.QLattice(random_seed=42)

# Sample and fit models
models = ql.auto_run(
    data=train,
    output_name='target'
)
Evaluating your models
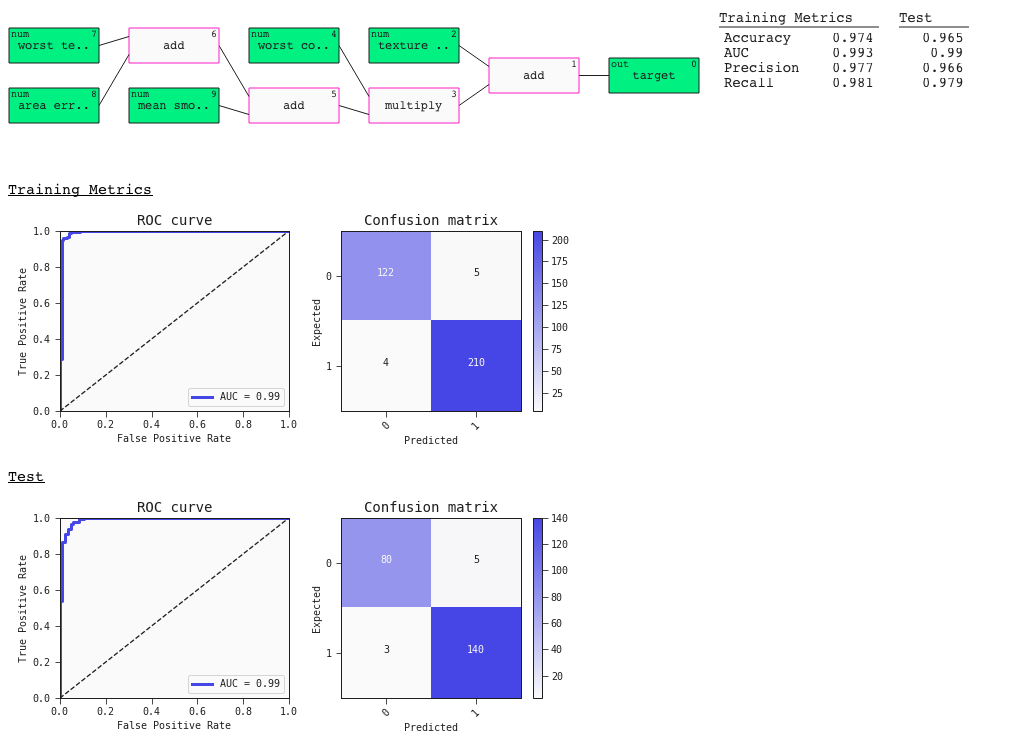
The auto_run function returns a list with the 10 best diverse models sorted by ascending loss. Here's a summary plot with metrics. This plot also contains useful default plots for your estimator - in this case the ROC curve and Confusion Matrix:
# Best model
best = models[0]

best.plot(train, test)

Further exploration
We didn't tackle all the options of auto_run. Here's where you can find more about them:
The method auto_run is a convenience function that wraps the Primitive Operations. If you want a more customisable QLattice run you can find the guides about them here.
