Plot probability scores
by: Chris Cave
(Feyn version 3.4.0 or newer)
The output of a binary classifier can be interpreted as the predicted probability of a sample belonging to the positive class. It is useful to see the distribution of scores to evaluate the quality of the classifier.
This plot only works for classifiers, and will return a type error if you try to use it on a regressor.
Example
import feyn
import pandas as pd
from sklearn.datasets import load_breast_cancer


# Load into a pandas dataframe
breast_cancer = load_breast_cancer(as_frame=True)
data = breast_cancer.frame

# Train/test split
train, test = feyn.tools.split(data, ratio=[0.6, 0.4], stratify='target', random_state=666)

# Instantiate a QLattice
ql = feyn.QLattice()
models = ql.auto_run(train, 'target', 'classification')
best = models[0]
Plotting the probability scores
The function plot_probability_scores plots a histogram of the probabilities of the passed dataset.
best.plot_probability_scores(test)
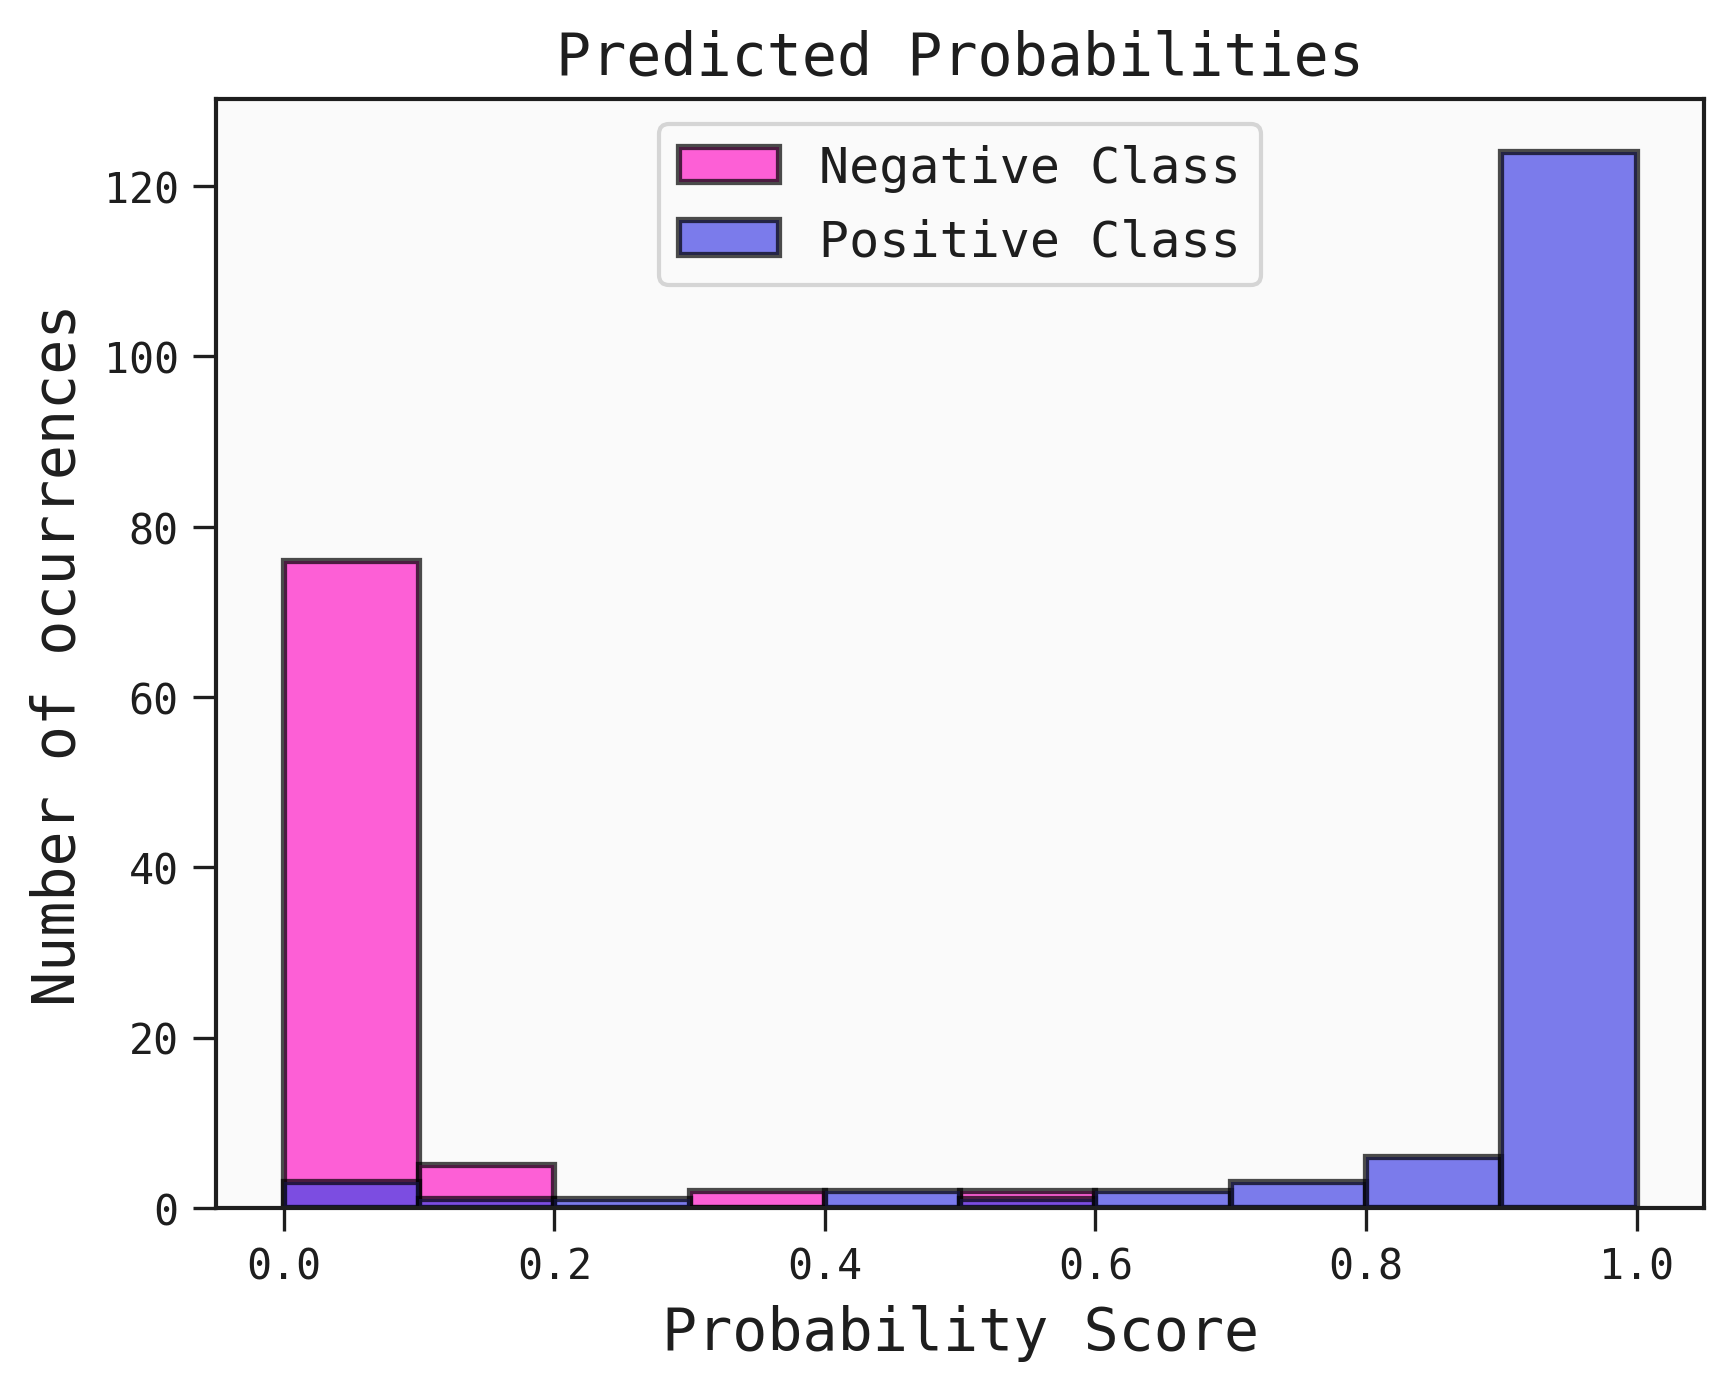
The different colours highlight the true classes of the samples. A good classifier would have a clear separation of the negative and positive class.
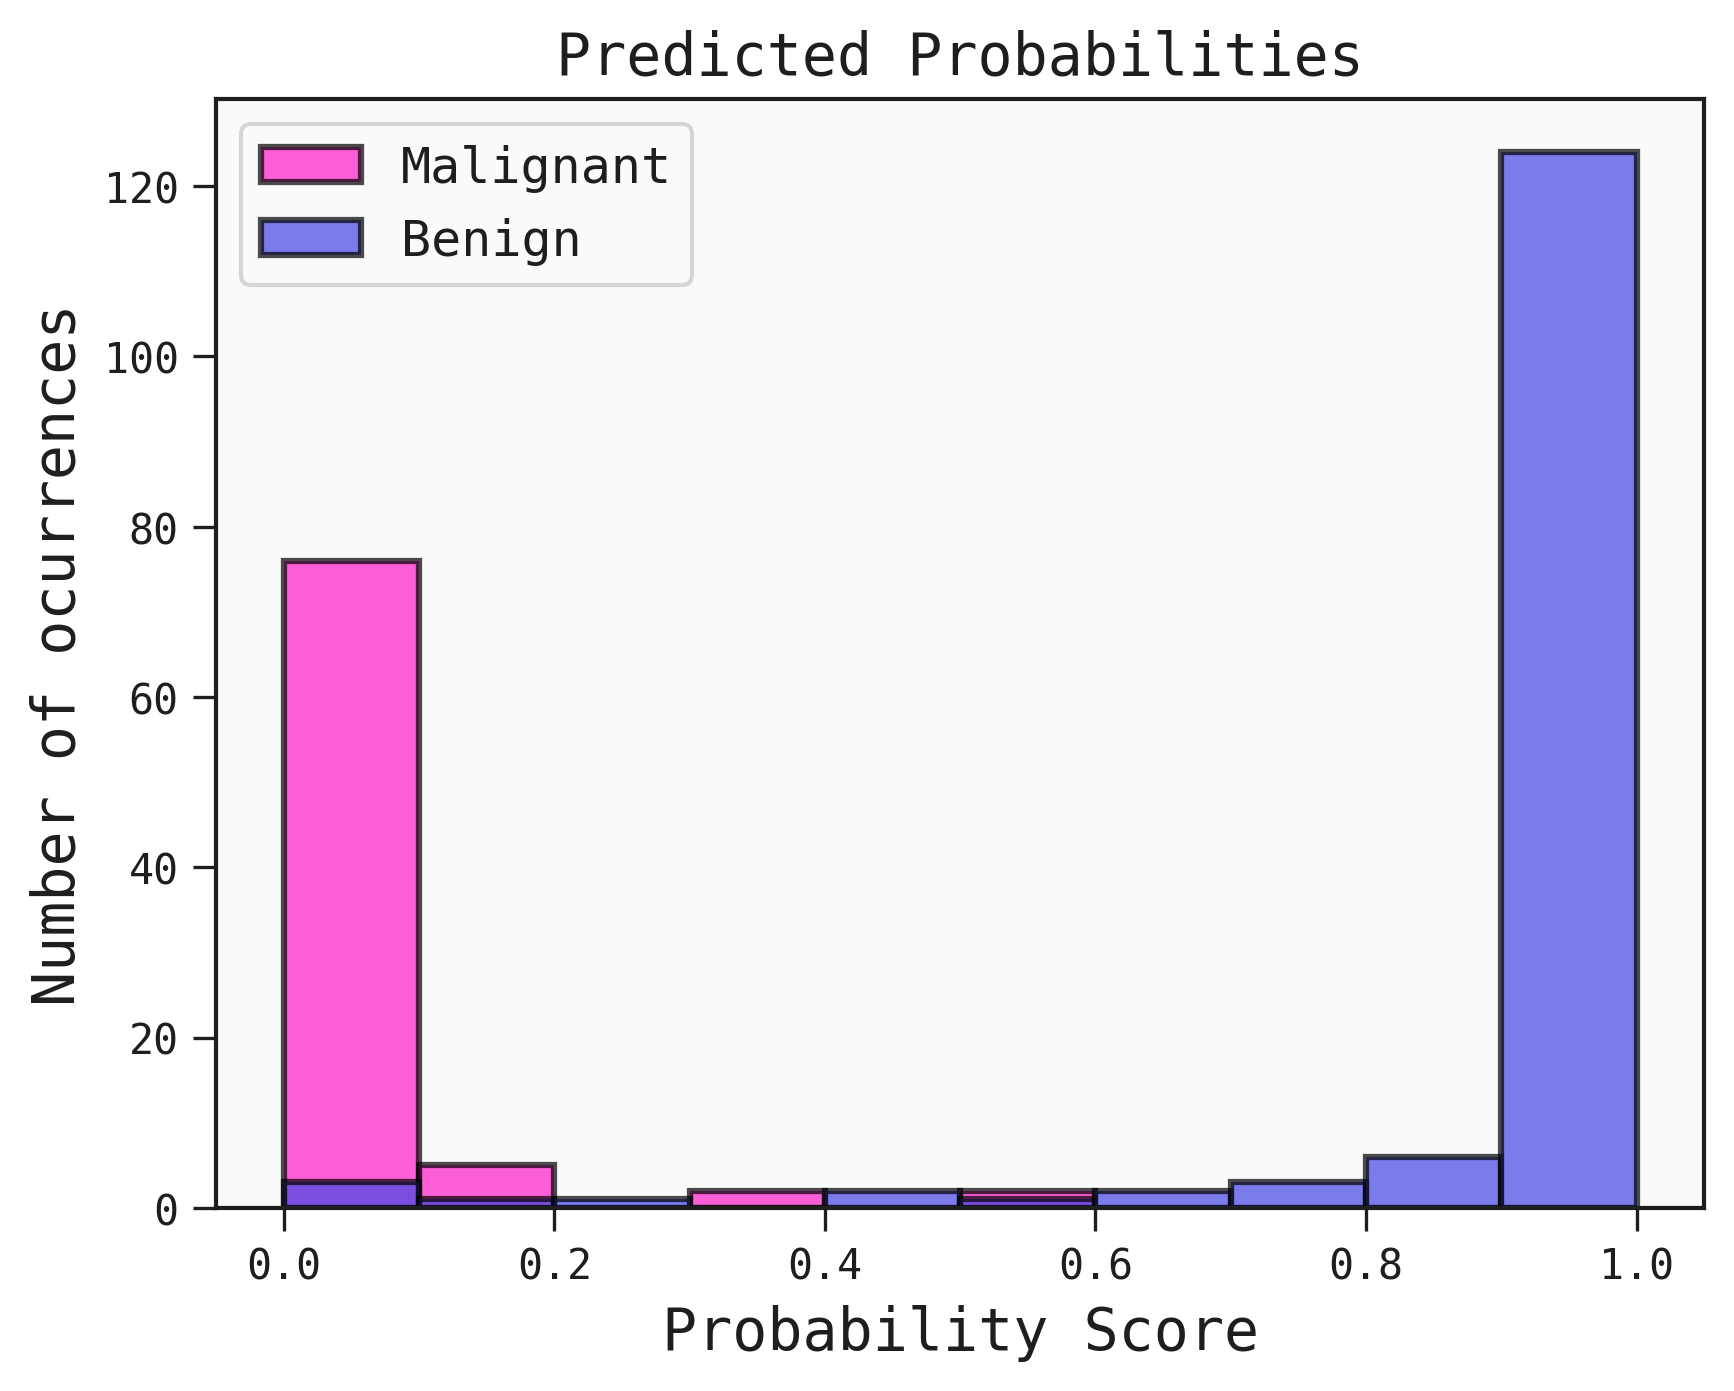
Customising the plot labels
You can customise the labels of the positive and negative class with your own labels, by supplying them to the legend parameter. You can also adjust the positioning of the legend.
The legend array goes in the order: Positive, Negative.
best.plot_probability_scores(test, legend=["Benign", "Malignant"], legend_loc="upper left")
Flipping the colors
There's a helper function on Theme to flip the order of the colormap used for this plot, so you can easily control the positive and negative end of the color scale without having to supply a new colormap for each plot you do throughout.
As a shorthand for the diverging colormap:
from feyn import Theme
Theme.flip_diverging_cmap()
Saving the plot
You can save the plot using the filename parameter. The plot is saved in the current working directory unless another path specifed.
best.plot_probability_scores(data=train, filename="feyn-plot")
If the extension is not specified then it is saved as a png file.
Location in Feyn
This function can also be found in feyn.plots module.
from feyn.plots import plot_probability_scores

y_true = train['target']
y_pred = best.predict(train)

plot_probability_scores(y_true, y_pred)